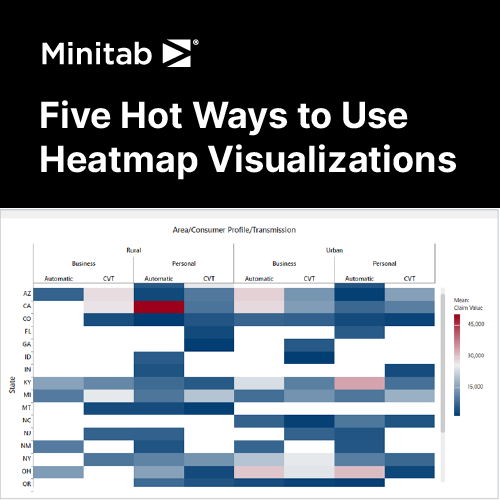
The heatmap is one of the hot new visualizations that were recently introduced in the latest Minitab Statistical Software. Heatmaps can help you visualize the impact of many categories on a numeric value and are an excellent choice for seeing details when dealing with larger datasets.
Let’s take a look at five hot uses for heatmaps.
• Customer churn
• Patient length of stay
• Project management
• High-expense areas
• Time-ordered data
For more information, reach out to our Minitab Team at msp@bluechipit.com.au.