Minitab-Main_1899x483
Prepare yourself for a data-driven world
Minitab has helped organisations drive cost containment, enhance product and service quality and boost customer satisfaction with our comprehensive, market-leading, best-in-class suite of analytics and process improvement solutions.

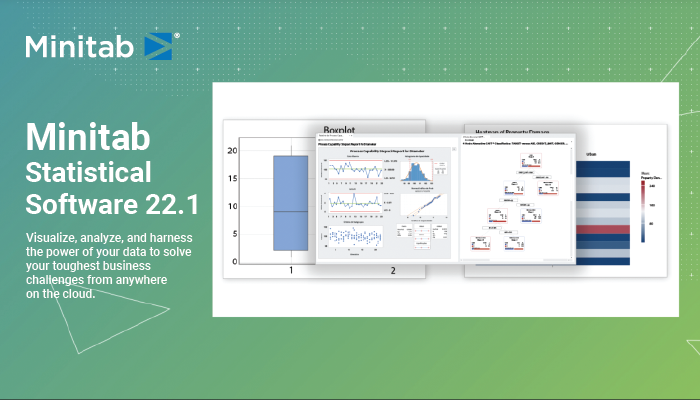
Minitab – MSS Version 22.1

This release contains new features listed below and bug fixes, so upgrading is recommended for all users.

New Features:

  • Enhanced Interactive Graph Editing
  • Gridlines
  • Reference Lines
  • Adjust Graph Size
  • Display Y-values
  • Refactored graphs to support graph editing
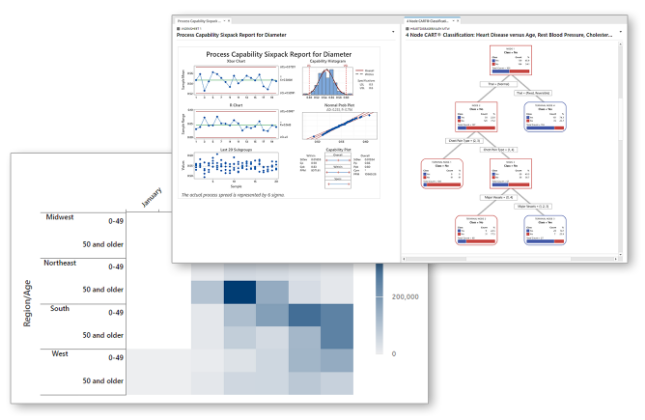
  • Capability analyses have been expanded to include non-parametric capability analysis and automated capability analysis
  • One proportion test has been expanded with additional methods to calculate the hypothesis test and confidence interval
  • Evaluate Measurement Process (EMP Crossed) is now available to use Wheeler’s Method to assess the variation in a measurement system
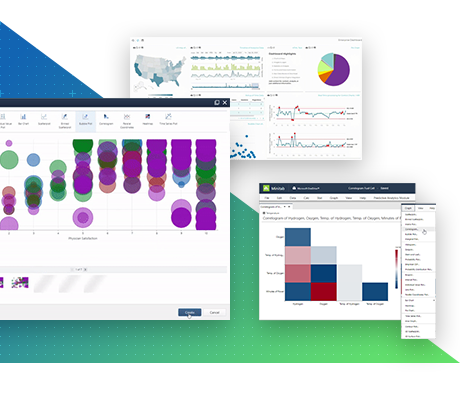
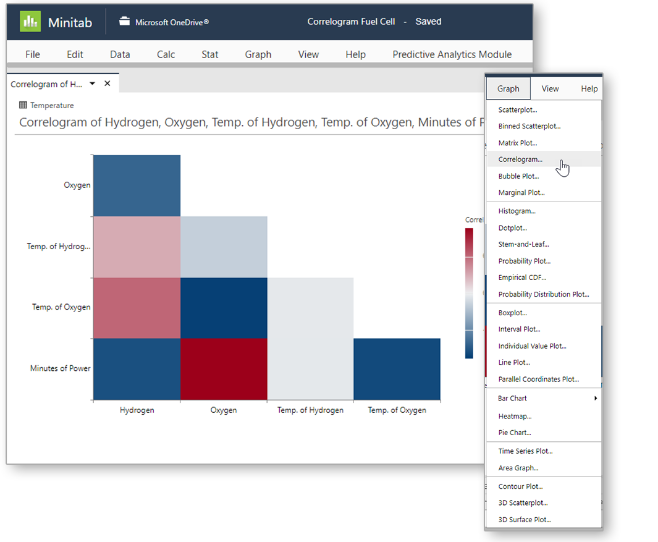
  • Graph Builder now includes tabulated statistics and Pareto charts

Minitab’s solutions solve your greatest analytics challenges.

Powerful statistical software everyone can use to solve their toughest business challenges. Best-in-class statistical platform you can access anywhere, anytime on the cloud.

EXPLORE OTHER PRODUCTS

Start, track, manage and share improvement initiatives to achieve business excellence. Explore our leading CI and innovation tools, customizable workflows and KPI dashboards.

Upcoming Webinar

Sign up for our webinar to see Cheryl Pammer, Minitab’s Senior Advisory Statistician, showcase the new statistical features, enriched visualizations, and enhanced AI capabilities available in Minitab Statistical Software. You will also discover how the latest release of Minitab Statistical Software can make your data analysis smarter, faster, and easier than ever.

About Us

Our mission is to help people discover valuable insights in their data.

Minitab helps companies and institutions to spot trends, solve problems and discover valuable insights in data by delivering a comprehensive and best-in-class suite of statistical analysis and process improvement tools. Combined with unparalleled ease-of-use, Minitab makes it simpler than ever to get deep insights from data.

For nearly 50 years, Minitab has helped organizations drive cost containment, enhance quality, boost customer satisfaction and increase effectiveness through its proprietary solutions. Thousands of businesses and institutions worldwide use Minitab® Statistical Software, Minitab Connect®, Real-Time SPC Powered by Minitab®, Salford Predictive Modeler®, Minitab Workspace®, Minitab Engage , and Quality Trainer® to uncover flaws and opportunities in their processes and address them. Minitab Solutions Analytics is Minitab’s proprietary integrated approach to providing software and services that enable organizations to make better decisions that drive business excellence.

POWERFUL STATISTICAL SOFTWARE EVERYONE CAN USE

Predict. Visualize, analyze, and harness the power of your data to solve your toughest business challenges from anywhere on the cloud.

Harness the power of statistics.

Data is everywhere, but are you truly taking advantage of yours? Minitab Statistical Software can look at current and past data to discover trends, find and predict patterns, uncover hidden relationships between variables, and create stunning visualizations to tackle even the most daunting challenges and opportunities.

With powerful statistics, industry-leading data analytics, and dynamic visualizations on your side, the possibilities are endless.

Discover

Predict

Achieve

Discover

Regardless of statistical background, Minitab empowers all parts of an organization to predict better outcomes, design better products, and improve processes to generate higher revenues and reduce costs. Only Minitab offers a unique, integrated approach by providing software and services that drive business excellence from anywhere with the cloud.

Key statistical tests include t tests, one and two proportions, normality test, chi-square, and equivalence tests.

Predict

Access modern data analysis and explore your data even further with our advanced analytics. Skillfully predict, compare alternatives, and forecast your business with ease using our revolutionary predictive analytics techniques.

Use classical methods in Minitab Statistical Software, integrate with open-source languages R or Python, or boost your capabilities further with machine learning algorithms like Classification and Regression Trees (CART®), TreeNet® and Random Forests®, now available in Minitab’s Predictive Analytics Module.

Achieve

Seeing is believing. Visualizations are critical to accurately communicate findings and achievements. Deciding which graph best displays your data and supports your analysis is fast and easy with Graph Builder.

Our new interactive tool with an easy-to-browse gallery lets you view and explore multiple graph options without re-running your analysis. Using the same selection of data each time, Graph Builder seamlessly updates from bar charts to correlograms to heat maps and more, so you can focus on choosing the best visual for your insights.

Ready for a demo of Minitab Statistical Software?

VISUAL TOOLS TO ENSURE PROCESS AND PRODUCT EXCELLENCE

Discover. Elevate your work with the ultimate toolkit to clearly visualize, optimize and map your business value better than ever before.

All the essential visual business tools in one place

Searching for simple solutions to achieve the greatest impact with your work and provide business value? Minitab Workspace enables you to move work forward with powerful visual tools, process maps, brainstorming diagrams and forms in one intuitive interface right at your finger tips. Our tools help form processes and identify opportunities, ultimately making problems easier to solve.

Visualize

Optimize

Prioritize

Map

Process Map

Build flowcharts with ease to help understand, see and communicate all the activities in a process with the added ability to customize the level of detail necessary.

Fishbone

Map out and identify every relevant element for a holistic view of your processes or projects, regardless if they are simple or complex.

Value Stream Map

Visualize the flow of deliverables and information through your organization, department, or team and showcase the value it creates for your customers and stakeholders.

Failure Modes and Effects Analysis (FMEA)

Mitigate risk of failure in a process or product design by identifying potential failures and taking the actions needed to achieve projected goals.

Note: Workspace’s FMEA meets the latest AIAG-VDA Standards to ensure industry-leading standards for product and process development.

Five Whys

Determine the root cause of a problem through direct questions, relationship mapping and reflection to prevent recurrence in the future.

Ready to unlock the value of your data with Minitab?

Connect with Bluechip IT-Minitab Today!

Tap into our experienced product specialist and book a time to discuss your technological requirements. Let’s innovate the ever-so-changing world of technology together.

time to discuss, business meeting
Please enable JavaScript in your browser to complete this form.
Bluechip Infotech Account